Visual Thinking — an essential skill in Product Management
The value of visual thinking in product managment is underestimated.

Traditional ways of working with many reporting layers, written handovers, and linear structures have been erupted by agile, iterative, and lean approaches — which are the only way to approach an increasingly dynamic and fast-paced environment.
All these new ways of working have one thing in common; they need a high degree of visual techniques to stimulate collaboration. These techniques improve the speed, creativity and effectiveness of teams as they collaborate in a dynamic environment
— Willemian Brand, 2022
Luckily, visualization has already found its way into our daily work through methods like design thinking, Kanban boards, user story maps or prototypes. However, there is way more value to be leveraged as soon as all product people start to learn, practice, and apply not only visualizations but visual thinking in their daily work.
Therefore, I believe that visual thinking is a central skill all product managers should have or start to practice.
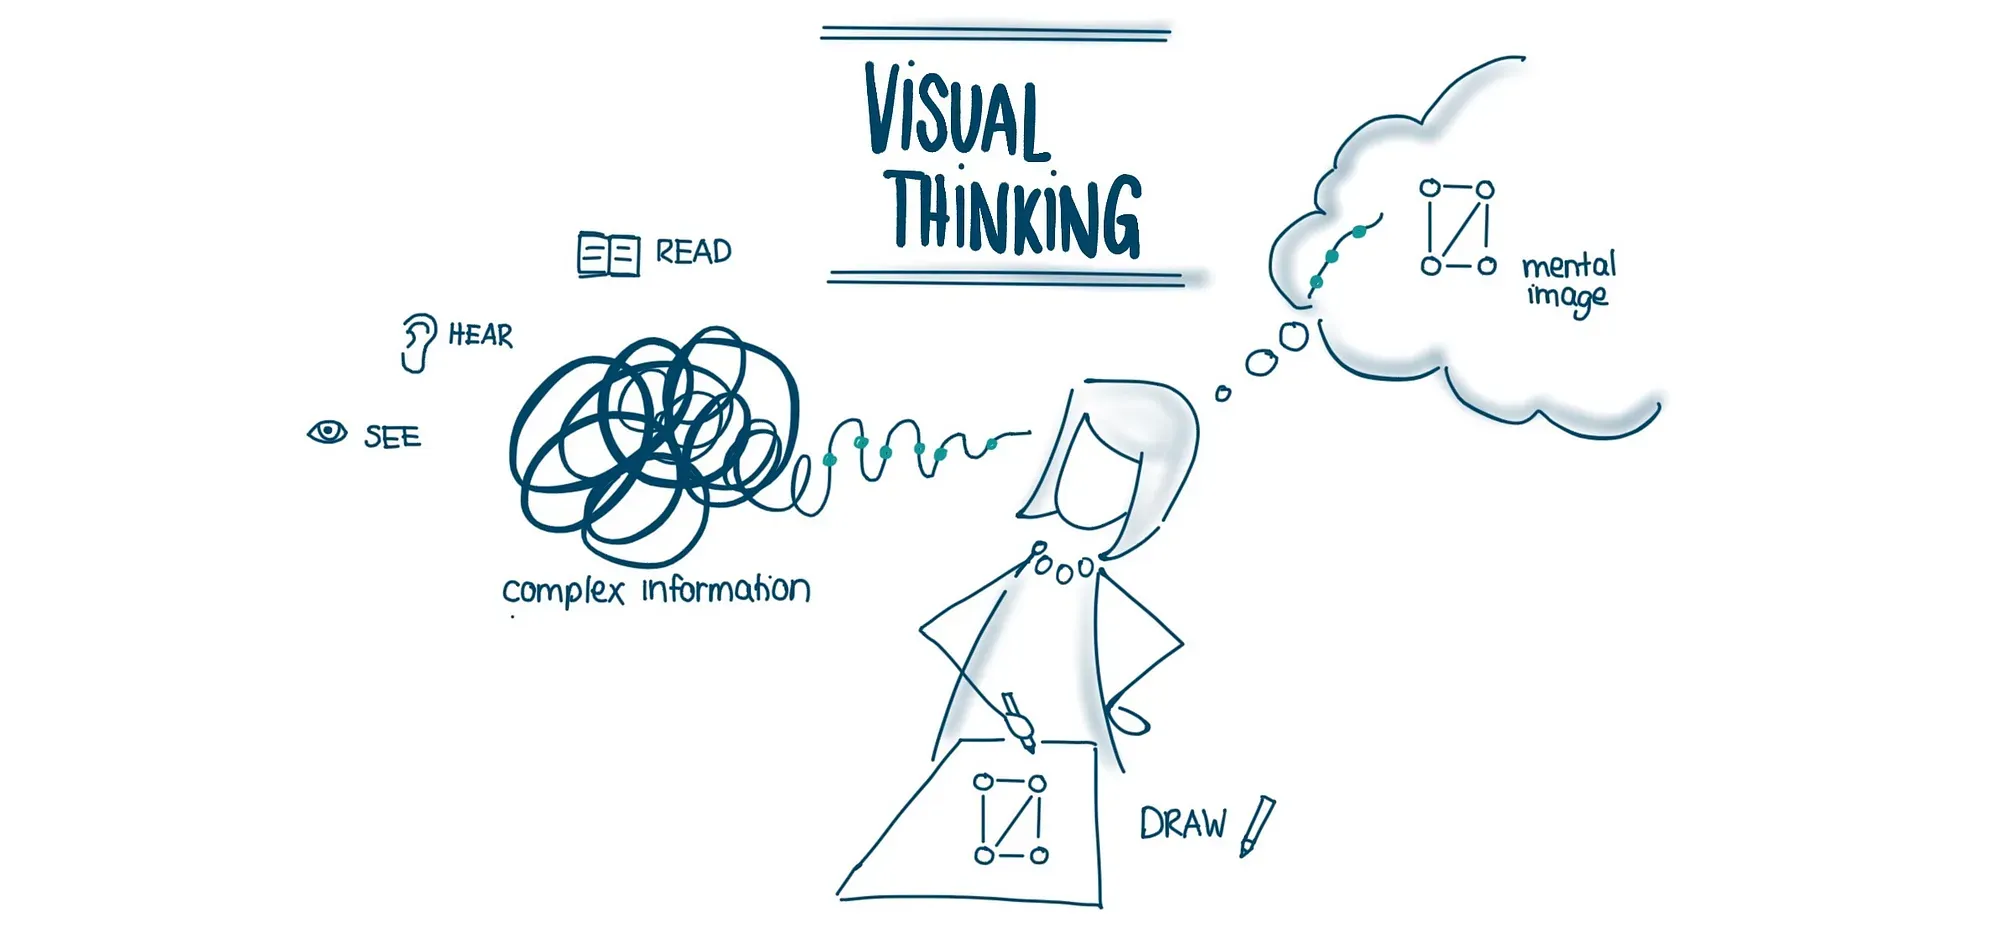
What is visual thinking?
Visual thinking is a process of learning new information and organizing thoughts by visually processing them. It can be used to make complex information which we see, hear, or read accessible — not only for ourselves but also for others.
Visual thinking helps me process information by connecting them with mental models and images in my brain. Mental models are simplified representations that reflect processes and structures in the world which have developed from our past experiences, memories, perceptions, and knowledge. They are an essential part of our daily lives because they influence our thinking, our behavior, and our approach of solving problems.
Jay Forrester, a pioneer in digital computer development, author, and lecturer, explained it that way:
The image of the world around us, which we carry in our head, is just a model. Nobody in his head imagines all the world, government or country. He has only selected concepts, and relationships between them, and uses those to represent the real system.
Therefore, visualizing my thought process helps me to externalize those mental images and make them explicit, in order to:
- get access to what I am actually thinking
- analyze my own thinking (and certain gaps it might have)
- and to share my thoughts with others
What’s the value of visual thinking?
Many people who want to start with visual thinking see the value in the output of the process: the visualization itself. And yes, the visualization is great! It helps to communicate thoughts, share information and create a common understanding with others.
However, I think the biggest value lies in the process itself: the creation of the visualization. The creation of a picture enables us to externalize our thought process. This externalization helps to focus on a certain aspect of a topic and, therefore, have less information overload — especially for complex matters this is key! Visual thinking brings me into a state of really deep thinking and concentration.
")
When I draw:
- I order my thoughts
- I see patterns, I have not seen before
- I am able to simplify complex matters
- I get new ideas
All of this has a huge impact on working with others. By visualizing, I make my perception of the world accessible for others. This helps to discuss complex matters and, therefore, leverage the value of cooperation.
How can you make use of visual thinking in product management?
While visualization is already used a lot for the ideation of solutions and prototyping of ideas, many product managers miss out on using visualization in the phase before: the discovery of new product and market opportunities. In this phase the most important aspect is not the visualization or the design (e.g. a mock-up of the solution) but the abstraction of the topic, the alignment in the team, the reduction of complexity and the preciseness of understanding the customer problem.
Getting alignment in the team & defining a starting point
When discovering a new opportunity, it is essential, to begin with the knowledge which is already existing in the team/organization. You must align the team around the status quo to give a clear starting point:
What do we already know? What do we assume to know? What do we not know? Where do we disagree?
This is crucial to clarify the scope, the research questions and the hypotheses on which the research process will be based. Many teams who skip this alignment in the beginning tend to get lost throughout the process or waste time in endless discussions.
In order to get this alignment in the beginning, I am a huge fan of Teresa Torres´ experience map, which she explains in her book Continuous Discovery Habits. I like that the method describes how a team should approach the visualization process, not what the output looks like.
The steps Teresa Torres describes are the following:
- Set the scope of the experience map: this defines how broad or narrow the topic will be
- Work individually — to avoid group thinking in the beginning
- Experience maps are visual not verbal
- Explore the diverse perspectives of you team: share your drawing, clarify your thinking and answer questions
- Co-create a shared experience map in the team
Eventually, an experience map is just a visualization of what you know — it can be a process, a concept map, a story line, a graph or what ever helps to get a common understanding of the topic.
Synthesizing information & creating insights
After or while doing interviews, screening data and researching online it is important to synthesize the information that is being collected continuously. Synthesizing is not summarizing! It is not about bringing information into fewer words — it is about comparing or combining topics and finding patterns in order to create new insights.
And yes, visualization is the best way to do this and to find those patterns! There is not ONE visualization that you should always use, but especially when you get started, it helps to have a look at examples of how information can be visualized:
")
There is no right or wrong! It is just about getting started and doing it. I iterate continuously on my drawings and if I get stuck, I try to change the perspective on how I look at the collected information.
I always recommend product managers not to do all the research and then start synthesizing. There is no clear point at which to stop and synthesize - it is about “synthesizing as you go”.
This is how I do “synthesizing as you go”:
- During an interview, I write down the essential information that I am hearing (and a second person is doing this as well)
- We follow up with a de-brief of the interview and summarize the information.
- Then, I draw the underlying structure which I have heard in the interview and write down the most important insights that come to my mind while drawing. I might even connect the drawing with the experience map from the beginning.
- I share my drawing with the team, involve their feedback, clarify open topics and improve the interview questions for the next interview.
- Then I repeat this for a couple of interviews.
- After having conducted a couple of interviews and maybe having involved other data points, I look at all the drawings and condense them in a new visualization. Many times I suddenly find a pattern or a structure that I had not been aware of before and which brings clarity or preciseness into the research, which makes a huge difference in the end.
Share learnings and drive organizational learning
However, all of those visualizations are not just important to find patterns and get a deeper understanding of the customer, they also help to drive organizational learning. Not only product and engineering needs to understand the market and the customer - (product) marketing, sales and customer success also need to get educated.
Therefore, the product team should not only share information to feature launches but also on underlying market structures, customer processes and pain points. Visualizations created throughout the discovery process are a great tool to tell stories and take the whole organization on a continuously learning journey. Here you can also get in support from Designers to make your drawings more appealing if you do not feel comfortable to share yours with the whole organization.
Share learnings and drive organizational learning
When you start with visual thinking, I would always recommend to start with pen & paper. You get reminded of childhood days when you where not afraid of drawing and you can just start exactly at this moment, without any setup and distraction.
As soon as you feel comfortable with pen & paper you can start using digital tools like Miro, Excalidraw, or apps like Concepts (this is the one I use) or Procreate on a tablet. It took me some practice to feel comfortable with a digital drawing tool, but as soon as you have some routine, it is just amazing :)
Furthermore, I can recommend to practice drawing by setting up an icon library or a visual alphabet. This helps to practice thinking in simplified pictures - for instance: an idea is a light bulb, a goal is a dart board or a start up is a rocket.
And, do not confuse visual thinking with graphic recording. The focus of visual thinking is not summarizing information and making it look appealing — the focus is the process of thinking and collaborating through visualizations. Therefore, the visualization does not have to look “perfect”, it is about making it good enough to understand a topic, to discuss it, and to learn.
In the end the most important thing is just to get started, trust in yourself and to have the courage to follow your gut feeling in drawing.
")
My name is Julia Bastian and I am VP product at Alasco .
During my time as UX researcher, Product Manager, and VP Product my biggest strength has always been to simplify complex topics, and therefore, make it accessible for others — and the basis for this has always been visual thinking.
Since I love complex topics I have found my passion in the B2B product world and in product discovery. Get in touch with me on LinkedIn for feedback or questions.